Thursday, August 27, 2015

Real Estate Crash: Small Losers, Bigger Losers

By Harry S. Dent Jr., Senior Editor, Economy & Markets


"I like to practice what I preach. I don’t own my home. I rent.

I’ve been renting my house in Tampa since October 2005, because I’ve seen what’s coming – the bursting of the greatest real estate bubble in modern history.

I don’t want to get caught up in the storm when it hits… and I don’t want you to either.


That’s why I’ve been saying you should sell all non-essential real estate as this bubble has rekindled – and hence, is in danger of bursting again.

I realize that’s not an easy decision to make. I can talk people out of stocks, but real estate is a more emotional issue.

You might have grown up in that house. Plan to retire – even die – there. Or just plain not want to move!

But the fact is, when real estate starts to fall, it can become very illiquid. Once the market realizes that there’s far more supply than there ever will be demand, selling your home for what you consider a reasonable price will become damn near impossible.

If you plan to retire off your home – or your home equity holds any major part of your retirement plan – you should change your plans. Home values will only depreciate in the years to come.

However… that doesn’t mean real estate will fall the same across the board.

This is a question I received recently: When real estate falls, will it be across the whole market, or more specific to cities with massive real estate bubbles?

In other words: “Harry, do I really have to sell my home?”

The quick and dirty answer is – of course it will be different.

Several factors go into pricing real estate regionally. Supply and demand. Migration from other parts of the country. Immigration from around the world.

For those reasons, the major cities are naturally the most bubbly. They attract immigration from wealthy foreigners (namely the Chinese) so they can educate their kids and launder their money out of their home country.

Vancouver, Sydney, Melbourne, London and Singapore are some of the best examples internationally. In the U.S., the coastal cities tend to be the most bubbly – New York, San Francisco, L.A., Miami, D.C., San Diego, Boston and Seattle.

When the massive and unprecedented Chinese real estate bubble implodes, it will impact many of these cities most directly.

So of course the bubbliest cities will get hit the worst. The smaller and more inland cities and counties less so.

But that doesn’t mean you won’t be hit too.

Overall, our country is looking at a real estate crash of 46% or more from the bounce since 2012. If real estate falls back to its 1996 lows – my worst case scenario – we could see a loss as much as 59%.

See the chart below, which shows the potential decrease into 2017 or later. Real estate could slide back to January 2000 levels when this bubble started, or as far as to 1996 lows:


The Downside Risk in Housing


You’ll notice this bubble had started to burst with a 34% crash during the subprime crisis, then ticked back up when the Fed and central banks around the world decided to inject our markets full of crack (read, quantitative easing).

So when this bubble bursts, for the final time this round, we’re looking at returning to either the 2000 or 1996 levels – 1996 being the worst scenario.

The chart below shows the range of this downside risk in 20 major cities across the U.S. based on these 1996 and 2000 prices:

You can tell that there are huge variations in these downside risks. They range from -5% at the 2000 lows in Cleveland, all the way to -67% to the worse 1996 lows in L.A.

Tampa, where I live, has a downside risk of -37% to -45%.

Do you understand why I don’t own a home in Tampa!?

Of course, this chart doesn’t tell the whole story.

Dallas and Denver are two examples of cities that did not bubble up as much going into 2006, so they didn’t get as clobbered in the last crash.

But since then, they’ve bubbled to new heights – partly due to the fracking revolution, which is just another symptom of this artificial economy as the housing market itself!

Again, I understand real estate is an emotional issue. But I’m warning you – there will be no mercy in this upcoming global financial crisis when credit bubbles like our housing market start spontaneously combusting.

My number one rule is: the greater the bubble, the greater the burst.

My number two rule: look at what your real estate – residential or commercial – was worth when the bubble started in January 2000. If you’ve built a home since then, check your city’s averages. That best defines your downside risk in a complex real estate market across the country.

Don’t wait to see what happens first. Price your property to move. Then sell quickly...."


Sobering perspective..."Remembering the Summer of 1929" (Video--worth the time.)


LINK, Further Commentary


Wednesday, August 26, 2015

"Are You Ready For the Next Leg Down?"

"The last 12 months has seen a sharp shift in tone regarding criticism of the Fed. Up until 2014, the mainstream financial media’s view of the Fed and its policies was that they had saved the financial system in 2008 and generated an economic "recovery."

Anyone with a working brain knew this was bogus: you cannot solve a debt crisis by issuing more debt. But because the financial media makes its money from financial firms’ advertising Dollars, it (the media) was happy to promote the narrative that the Fed was omniscient and expertly adept at managing the economy.

Then things began to change.

First in the summer of 2014, Congress moved to introduce new oversight of the Fed’s policies, particularly regarding its control of interest rates.

Then the Fed was ensnared in a “leak” scandal indicating it had been providing insider information to key individuals before the public (the Fed has been leaking information for years... but the fact it became common knowledge was new).

And then a growing number of commentators began to point out that the Fed’s QE programs didn’t actually do anything for the general economy, but did increase wealth inequality.


It is this last item that has proven to be the most problematic for the Fed… particularly now that the markets are collapsing with interest rates already at zero. 

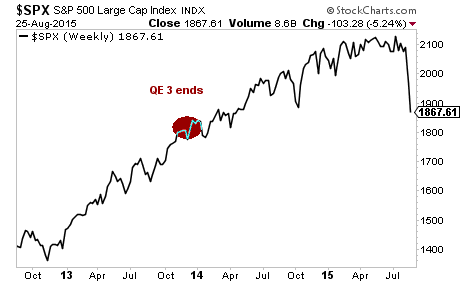
The Fed has openly stated that QE was a success because it pushed stocks higher. However, it’s hard to swallow this when stocks erase ALL of their post-QE 3 gains in a matter of four days.


GPC 8-26-15.png


In simple terms, the market collapse of the last week has proven point blank that the Fed’s theories are bogus and not based on reality. Moreover, now that the financial media has begun to promote the narrative that QE creates wealth inequality, any new QE program would be seen as a bailout of the wealthy.

This means the Fed will be unable to directly intervene to prop the markets up. We get evidence of this from the fact that NO Fed officials appeared yesterday to provide verbal intervention for the markets.

Every other time the markets has broken down in the last six years, a Fed President appeared to talk about some new policy to prop the markets up.


NOT THIS TIME. The Fed's silence signals that things have changed in a big way. Smart investors should start preparing now. This mess is not over by any stretch...."

Graham Summers
Phoenix Capital Research


Tuesday, August 25, 2015

"Central Banks Will Be Powerless to Stop this Crisis"

"The financial system is in uncharted waters... and it's not clear that the Fed has a clue how to navigate them.

A number of key data points suggest the US is entering another recession. These data points are:

1)   The Empire Manufacturing Survey

2)   Copper’s sharp drop in price

3)   The Fed’s own GDPNow measure

4)   The plunge in corporate revenues

Why does this matter? After all, the US typically enters a recession every 5-7 years or so.

This matters because interest rates are currently at zero. Never in history has the US entered a recession when rates were this low. And it spells serious trouble for the financial system going forward.


Firstly, with rates at zero, the Fed has little to no ammo to combat a contraction. Some Central Banks have recently cut rates into negative territory. However, this is politically impossible in the US, particularly with an upcoming Presidential election. 

This ultimately leaves QE as the last tool in the Fed’s arsenal to address an economic contraction.

However, at $4.5 trillion, the Fed’s balance sheet is already so monstrous that it has become a systemic risk in of itself. And the Fed knows this too… Janet Yellen, before she became Fed Chair, was worried about how the Fed could safely exit its positions back when its balance sheet was only $1.3 trillion during QE 1 in 2009.

Moreover, it’s not clear that the Fed could launch another QE program at this point. For one thing there is that aforementioned upcoming Presidential election. Another QE program would just be fuel for the fire that is growing public anger with Washington’s meddling in the economy. And this would lead to greater scrutiny of the Fed and its decision making.

Even if the Fed were to launch another QE program in the next 15 months, it’s not clear how much it would accomplish. A psychological shift has hit the markets in which investors’ faith in Central Bank policy is no longer sacrosanct.

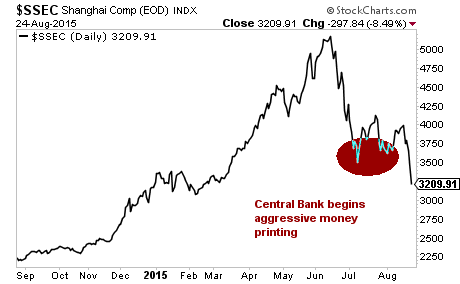
Consider China, where despite rampant money printing, the stock market has continued to implode, crashing to new lows. China’s Central Bank is pumping $29 billion into its stock markets per day.  This bought a few weeks of a bounce before Chinese stocks continued to collapse.


GPC 8-25-15.png


In short, as we predicted, Central Banks will indeed be powerless to stop the next Crisis as it spreads. The Fed could potentially go “nuclear” with a massive QE program if the markets fall far enough, but this would only accelerate the pace at which investors lose confidence in Central Banks’ abilities to rein in the carnage.


Smart investors should start preparing now. What happened on Monday was just a taste of what's coming...."


Graham Summers
Phoenix Capital Management


Bubbles Don’t Correct, They Burst


By Harry S. Dent Jr., Senior Editor, Economy & Markets


"...the second greatest bull march in history is finally coming to an end. It’s done.

Wall Street thinks this is a correction – a 10% drop, maybe 20% at worst, followed by more gains. They think we’re just six years into a 10 if not 20 year bull market. This is just a healthy breather.

Of course they think that! It’s the same “bubble-head” logic you find at the top of any extreme market in history!

Every single time – without exception – we delude ourselves into believing there is no bubble. We think: “Life’s good, why should we argue with it?”

And every time, we’re shocked when it’s over. Only in retrospect do we realize, yes, that was clearly a bubble, and oh, how stupid we were for not seeing it.

Bubbles don’t correct. They burst. They always do. And if anyone is still doubting whether this is a bubble, they need to get with the program – now!


Like I said on Fox yesterday, I wasn’t always a bear. I was one of the most bullish forecasters since the late ‘80s because I discovered how you can predict the spending of consumers through demographics.

With one simple indicator I predicted the Japan crash in the ‘90s when everyone was saying they’d overcome the U.S.

I predicted the greatest boom in U.S. history thanks to the spending of the Baby Boomer generation. All from demographic research, driven by my top cycle, the Spending Wave.

And from that, we knew the Boomers would peak in 2007 followed by a slowing economy.

So after the U.S. and global stock markets finally burst in 2008, central banks stepped in and began an unprecedented and globally orchestrated effort to stop it.

We’re not the least bit unclear about why this unprecedented stimulus has only created mediocre 2% growth and little to no inflation.

It’s turned into one big game of “Whack-a-Mole” with the economy. They take one bubble burst, whack it with massive money creation, and then create the next bubble, wait for it to burst, and whack that one too.

What they can't seem to get through their heads is – you can't keep a bubble going forever!

We had the stock bubble in 1987, the tech bubble of early 2000, the real estate bubble in early 2006, another stock bubble into 2007, oil in mid-2008, gold in mid-2011 – and now, a final stock bubble into 2015.

They’ve all burst, or are still bursting!

Oil’s down more than 65% from its secondary peak in 2011 and was down 80% from its all-time high in 2008. Gold’s down 40% from its 2011 high.

Bubbles typically crash 70% to 80% before they fully deleverage. But when they burst, they usually kick off with a 20% to 50% slide right out the gate – most often within a matter of months.

Oil will keep falling – likely to $32 in the next month or so, crushing the fracking industry, and obliterating economies in the Middle East, Russia, and even Canada.

At the rate it’s been falling –$38 now – $32 is probably a conservative estimate! ,,,I’ve been predicting for many years that oil will eventually hit $10 to $20. [e.g., Gary Shilling also calling for $10-20 oil.]

How will the frackers survive that?

Simple: They won’t!

China’s stock market will also keep crashing – it’s already down 42%. When it does, its real estate will follow – with devastating consequences to real estate in the U.S. and the globe. And over the next several years, we’ll see the greatest global crash in real estate in modern history.

Even if stocks manage one more rally, there’s no avoiding the economic landmines all over. Over the last few trading days, we’ve seen how investors react to poor economic news.

The truth is that the markets are finally getting what we’ve been saying about the vicious cycle of China slowing. It hurts commodity prices and crushes emerging countries. No kidding!

When this bubble economy fueled through zero interest rates and endless QE finally does burst, it will only be worse.

This whole ordeal has taken longer than we would have initially expected from history. But it was unprecedented that central banks would come together on a global scale to fight a natural bubble-burst cycle with such massive money printing.

And whereas in 2007 we had a stock bubble driven at least somewhat by market fundamentals, in 2015 it’s just the long, drawn-out drama of a drug addict pumping too much heroine for too long. Now, detox is ahead!...."


Monday, August 24, 2015

Where Do You Think Oil Prices Are Headed? (1 chart)


"Did the Crisis of Our Lifetimes Begin Last Week?"

"Did the Crisis of Our Lifetimes Begin Last Week?

The market’s technical damage of the last week has been severe.

The stock market began its near-vertical climb in late 2012 after the Fed announced QE 4.
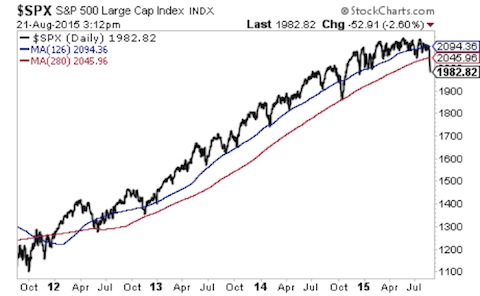
Since that time, the 126-day moving average (DMA) and 280-DMA have served as major lines of support for the bull market.

The 126-DMA acted as initial support whenever the market began to lose momentum. And if the 126-DMA was taken out by intense selling pressure, the 280-DMA acted as CRITICAL support, as it did in October 2014.

Last week we sliced through both lined without any difficulty what-so-ever.

GPC 8-24-15-1.jpg

Investors must now assess two key questions…

They are:

1)   Will the Federal Reserve intervene in the market with a new monetary policy (likely QE)?

2)   If the Fed does intervene, will the markets RESPOND to it?

#1 is an absolute certainty if the markets fall far enough.

In contrast, #2 is an uncertainty. When China’s stock bubble burst a few months ago, the Chinese regulators reacted by freezing the markets, banning short-selling, arresting short-sellers, and pumping tens of billions of 

Dollars into the market.

Despite this, the Chinese stock market continued to nosedive after a brief bounce.

GPC 8-24-15-2.jpg

This is an absolute first: stocks NOT reacting to Central Bank intervention. And it signals that we may in fact have reached the point at which Central Bank interventions no longer “save” the markets.

If this has happened, and the investment world has reached the point at which it no longer has faith in Central Banks’ abilities to prop up the markets, then THE major crisis of our lifetimes is here...."

Graham Summers
Phoenix Capital Research


Friday, August 21, 2015

"With the Fed and other Central banks now leveraged well above 50-to-1, even those entities that were backstopping an insolvent financial system are themselves insolvent."

"ALL of the so called, “economic recovery” that began in 2009 has been based on the Central Banks’ abilities to rein in the collapse.

The first round of interventions (2007-early 2009) was performed in the name of saving the system. The second round (2010-2012) was done because it was generally believed that the first round hadn’t completed the task of getting the world back to recovery.

However, from 2012 onward, everything changed. At that point the Central Banks went “all in” on the Keynesian lunacy that they’d been employing since 2008. We no longer had QE plans with definitive deadlines. Instead phrases like “open-ended” and doing “whatever it takes” began to emanate from Central Bankers’ mouths.

However, the insanity was in fact greater than this. It is one thing to bluff your way through the weakest recovery in 80+ years with empty promises; but it’s another thing entirely to roll the dice on your entire country’s solvency just to see what happens.

In 2013, the Bank of Japan launched a single QE program equal to 25% of Japan’s GDP. This was unheard of in the history of the world. Never before had a country spent so much money relative to its size so rapidly… and with so little results: a few quarters of increased economic growth while household spending collapsed and misery rose alongside inflation.

This was the beginning of the end. Japan nearly broke its bond market launching this program (the circuit breakers tripped multiple times in that first week). However it wasn’t until last month that things truly became completely and utterly broken.

A month or so ago,  China lost control of its stock market. Despite freezing the market, banning short-selling, arresting short-sellers, and injecting billions of Dollars per day into the markets, China's stock market continues to implode.


Please let this sink in: a Central bank, indeed, one of the largest, most important Central Banks, has officially "lost control."

This will not be a one-off event. With the Fed and other Central banks now leveraged well above 50-to-1, even those entities that were backstopping an insolvent financial system are themselves insolvent.

The Big Crisis, the one in which entire countries go bust, has begun. It will not unfold in a matter of weeks; these sorts of things take months to complete. But it has begun...."

Graham Summers
Phoenix Capital Management

LINK


Artificial (Fixed Investment, QE, etc.) Demand is Finally Collapsing?


Tuesday, August 18, 2015

The Deadliest Investment Myths. Real Estate Best or Worst? Etc.

By Harry S. Dent Jr., Senior Editor, Economy & Markets

EditorThe S&P 500 is struggling to even remain in positive territory this year. It’s on its last legs.

Then in some of the bubbliest cities, magnificent homes are still being built. Homebuyers and investors don’t seem to realize we’ve reached a peak!

Like I’ve said many times before, most investors pile into the markets with everyone else. They don’t get in closer to a market bottom like they should.

Worse, the last few get in after other investors have already picked up the gains. They have a huge misperception of risk. They think, the longer a market has gone up, the less risk there is. But the truth is that the longer and stronger a market’s advance, the more likely it is to go down – and to go down big time!

Think back to the tech bull market from October 1990 to March 2000. It resulted in one of the biggest bubble bursts of all time, with the Nasdaq falling 78%.

The most astute investors (AKA the “smart money”) buy at these times when the markets are down. Meanwhile, most investors shun them out of fear. Big mistake!

In reverse order, the smart money gets out at a market top when the last few investors decide now seems like a good time to pile in. That’s why, when it comes to making investments most Americans think you should, you should actually do the opposite!


This all follows a natural S-Curve pattern. The 0.1% get in first. Then the 1%. Then the 10%. That’s why these people so dominate wealth and income. They’re willing to take more risk. So they pick up the most gains!

Most investors get in somewhere in that 10% to 90% acceleration. Not at the beginning. Hence, what they think and do are not good indicators of the best future trends.

To give you some insight into what most Americans consider the best long-term investments, here’s a recent poll from Gallup, the premier surveyors of American attitudes:


Real estate is currently No. 1 at 31%. Except it’s the worst long-term investment by our research!

We’ve built way too many houses, and just don’t have enough people to fill them into the future. Since the Boomers are a larger generation than Generation X which followed, as they retire, downsize, and eventually die, real estate will fall with them. And I doubt it’ll ever reach these heights again.

Just look at Japan. It’s already proven that real estate can go down 60%, and not recover even 24 years after its peak.

Now, I don’t think real estate will drop as much as stocks in the crisis ahead. But the difference here is that most people have mortgages on their real estate, so the falls are more painful! The majority of homeowners who signed a 30-year mortgage today, or even 10 years ago, should not hope to see their investments appreciate. Period.

No. 2 on Gallup’s list are stocks, at 25%.

As I’ve already explained, most investors get into stocks well after they should have, and are too late getting out. Investors have been swooning over stocks as they’ve reached all-time highs… but that just means they have further to fall!

When this BS, artificially Fed-generated recovery finally fails, those investors will be sorry.

If I had to choose, I’d rather buy stocks than real estate right now, as stocks will actually recover after a major crash, even substantially. I can’t say the same for real estate.

Now on to No. 3. Everyone’s favorite metal – gold!

King Gold was at its peak in 2011 at 34% in the poll. Since then, it’s dropped to 19%. Still, it’s beating savings accounts and bonds… which in my mind are clearly superior.

Gold does have some redemption in times of crisis as I explained in Boom & Bust back in May. That could cause it to have a small bump when the next meltdown first hits. But ultimately gold has further to fall, to $750 initially then as far as $250.

That brings us to the last two: savings accounts and bonds.

Though only 15% of Americans name savings accounts as the best long-term investment, that is where investors should be in this unprecedented bubble, at least to a large extent.

Today, investing in a savings account would allow you to preserve your gains, sleep well at night, and have instant liquidity to buy when everything crashes ahead. But for some reason, no one wants cash today!

Although right now instead of savings I’d actually recommend you put your cash in safe short-term bonds – or a money market account in your brokerage account. That’s because banks can lend against a savings or checking account. As things crash ahead and too many loans go bad, banks may simply not have your money when you want it – as happened in the Great Depression!

Bonds come last in the poll at just 6%, and for most people that means safe Treasury or high quality corporate bonds. [These assets compose the majority of whole life insurance cash value.]

Such bonds were the single best investment by far from late 1929 to 1941 — they nearly doubled in value, as stocks and most investments were crucified. These same bonds could be very valuable moving forward through this economic winter season.

To summarize, investors have it totally upside down when it comes to the best long-term investments. It should be: high quality bonds [e.g., whole life insurance], savings (or money market accounts), gold, stocks, then real estate. Not the other way around.

Don’t follow the collective opinion of the majority of Americans. We tend to think there’s strength in numbers, and we’re biased to follow the crowd. But that doesn’t mean the majority gets it right. And in this case, the majority’s dead wrong...."


Harry Dent

Recovery? Where? Homeownership Hits 48-year Low (so far)...


Friday, August 14, 2015

Three Clear Signs the US is Back In Recession

"Three Clear Signs That the US is Already in Recession
The US economy is collapsing at a pace not seen since 2008-2009.
Retail sales are showing outright deflation, declining at a pace not seen outside of contractions.
The retail sector is not the only sector showing pronounced weakness.
General Electric (GE), JP Morgan (JPM), Microsoft (MSFT), IBM (IBM), Citigroup (C), Johnson & Johnson (JNJ), Intel (INTC), Coke (KO), Oracle (ORCL), Honeywell (HON), Goldman Sachs (GS), and American Express (AXP) have all reported a decline in Year Over Year sales for the second quarter of 2015.
These companies are not unusual in this regard. Across the board S&P 500 companies have posted a 4% drop in revenues.
The damage is heaviest in the commodity sector, particularly energy, but growth is anemic with the exception of healthcare (which is being boosted by the increase in costs due to Obamacare). Excluding healthcare, the largest growth is a mere 2.4%... and that is being concentrated due to a few key players.
This marks the second quarter of Year Over Year declines in revenues: something that has not occurred since the last recession in 2009.
H/T Charlie Bilello
 
Moreover, even earnings (which CAN be massaged to overstate growth) are showing signs of weakness.
Profit growth for the S&P 500 companies is at its weakest point since 2009. That’s because, in fact, there isn’t any profit growth.
S&P 500 earnings for the first half of the year are expected to show a 0.7% contraction compared to a year ago, according to numbers from FactSet research. Growth in the first quarter was a meager 1.1%, but the second quarter is more than offsetting that, expected to contract at a 2.2% rate, FactSet estimates.The last time the S&P 500 saw a year-over-year decline for the first half of a year was 2009, when earnings positively cratered at the depths of the global recession, down 30.9%.
Source: Wall Street Journal

The above hard data runs completely counter to the uptick in GDP growth shown by Fed's models. These items STRONGLY suggest the US is approaching if not already in a recession.
Stocks are completely misunderstanding this. And by the time they "get it" the markets will be a in a free-fall... ."

Graham Summers
Phoenix Capital Research


Tuesday, August 11, 2015

U.S. Economy Long-Term Prognosis: Hopeful. Steady Growth of Working Age Population (15-64)


"Forget the Fake Statistics: China Is a Tinderbox"

"When China's tinderbox economy implodes, who will be left to bid up the world's surplus commodities and real estate?
After 30 years of torrid expansion, perhaps the single most consequential factor in China’s economy is how much of it is a “black box”: a system with visible inputs and outputs whose internal workings are opaque.
There are number of reasons for this lack of transparency:
1. Official statistics reflect what officials want to project, not the unfiltered data.
2. Policy decisions are made behind closed doors by a handful of leaders.
3. There is little institutional history of transparency.
4. Many important statistics are self-reported and prone to distortion.
5. Large sectors of the economy are informal and difficult if not impossible to measure accurately.
6. Endemic corruption distorts critical economic yardsticks.
7. There is little historical precedent to guide policy makers and individual investors.
None of these is unique to China, of course, with the possible exception of #7: few nations in history (if any) have experienced an equivalent boom in infrastructure, credit, housing and wealth in such a short span of time.
Saving Face By Editing Data
As anyone who has lived and worked in Asia can attest, public perception (i.e. "face") is of paramount concern.  There is tremendous pressure to put a positive spin on everything in the public sphere.  Negative publicity causes not just the individual to lose face, but his boss, agency, company and family may also be tarnished.
For this reason, reporting potentially negative numbers accurately may put careers and hopes for advancement at risk.
This accretion of fear of reprisal/disapproval builds as it moves up the pyramid of command.  This process can lead to tragic absurdities being taken as truth.  In one famous example in Mao-era China, officials ordered rice planted in thick abundance along a particular stretch of road, so that when Chairman Mao was driven along this roadway, he would see evidence of a spectacular rice harvest.
In reality, China was in the grip of a horrific famine resulting from disastrous state policies (The Great Leap Forward). But since everyone feared the consequences of telling Mao his policies were starving millions of Chinese people, the fields along the highway was planted to mask the unwelcome reality.
Even the most honest reports reflect the biases of those summarizing feedback for their superiors. As a result, when the feedback finally reaches the top leadership, it may be inaccurate or misleading in ways that are difficult to detect.
The Dangers Of Opaque Leadership Decisions
All leaders have their own biases and experiential limits, and left unchecked by accurate feedback and honest dissent, these have the potential to generate disastrous decisions.
Perhaps the top leadership in China is soliciting honest dissent, but without a vigorously free media and multiple unedited feedback loops, this is unlikely for systemic reasons.
Most people—leaders and followers alike—seek to confirm their own views (i.e. confirmation bias). A system in which key decisions are not aired publicly and the trustworthiness of the data being considered behind closed doors is also unknown is a system designed to reinforce confirmation bias and yes-men.
In this environment, destructive policies may be supported by the chain of command despite the consequences.
Lack Of Institutional History of Transparency
Institutions with a long history of independence and a policy of priding transparency have the potential to counter the tendency of hierarchies to encourage confirmation bias and fudged feedback.
But China’s tumultuous history in the 20th century—invasion, foreign occupation, civil war, revolution, mass famines, the Cultural Revolution’s mass disruptions and purges, the end of Mao’s Gang of Four and Deng Xiaoping’s “to get rich is glorious” reforms—has not been conducive to the establishment of independent institutions.
Developing the independence of institutions in the midst of such unprecedented political, social and economic turmoil is a long-term work in progress. Though no comparison is entirely analogous, we can look at the first equally tumultuous 30 years of the American Republic (1790 – 1820) and the French Republic (1789-1819) for historical examples of the difficulties in establishing enduringly independent institutions.
Self-Reported Statistics
Self-reported data plays a significant role in any economic snapshot that measures sentiment and expectations. But when it comes to income, outstanding loans and other data, there’s no substitute for accurate numbers.
As a general rule, the larger the informal cash economy and the greater the leeway and the incentives to under-report, the lower the quality of self-reported statistics.
Take income as an example. In the U.S., the vast majority of non-cash income is reported directly to the tax authorities: wages, 1099s, sales of securities, etc.  The leeway to fudge income is low, which pushes the incentives to fudge onto the expense/deduction side of the ledger.  For this reason, IRS income data is more trustworthy than self-reported measures of income and employment.
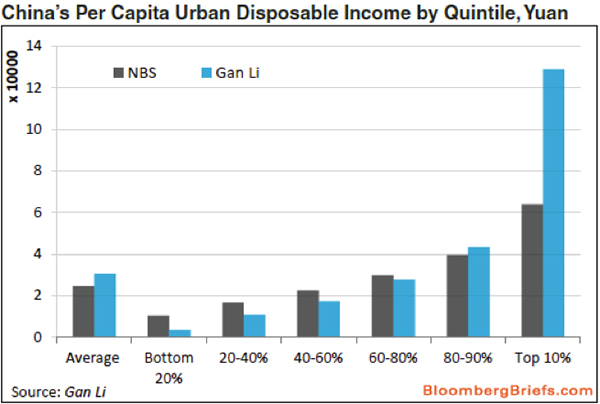
Consider this chart of household income in China.  A survey of households found incomes were much higher than the officially collated numbers. In the case of the top earners, the difference was significant enough to skew a variety of key numbers such as household income as a percentage of GDP.
The differences between official data and data collected by surveys is troubling for a number of reasons... ."

Sunday, August 9, 2015

The China Economic Lie Continues

"The China Economic Lie Continues

By Harry S. Dent Jr., Senior Editor, Economy & Markets


EditorI and a few brave experts such as Jim Chanos, Gordon Chang, and David Stockman...have been arguing for years that China has the greatest investment and overbuilding bubble in all of modern history.

We’ve also warned that its economic statistics are not real – they are purposefully overstated and then revised later, if at all.

I don’t see how this top-down dinosaur of a centrally planned government can continue in power. I don’t even know how it can exist in a free market/democracy-driven age that already saw the centrally planned economy of the Soviet Union fail miserably.

This is their current strategy to stay in power: Hiring low-skill workers to build more infrastructure and real estate than is actually needed, and keep moving unskilled immigrants from rural to urban areas on a scale never before seen in history…

The demand isn’t even there! They’re just building things no one’s going to use just to keep these people employed and happy. It can’t continue. And when it doesn’t, I don’t see how China will be able to stop these people from revolting. 


Since 1983, over half a billion Chinese have moved to the city. 220 million of those just since 2002!

And there are now over 220 million urban residents that are not legal citizens where they live – like illegal aliens from Mexico here in the U.S.

Do you see a problem if this overbuilding and debt-fueled strategy of over-expanding finally ends?

There will be hundreds of millions of unskilled workers stuck in cities. And they won’t even be able to go back to their rice paddies. By now they’re probably paved over with empty condos!

China’s government thinks if it keeps the people employed then they won’t question the corrupt, crony capitalist system in place. So it continues to push its top-down planning through local communist governments that almost totally drive infrastructure and business investment – with no regard whatsoever for free markets!

Sound like a success strategy?

Economists call this an “economic miracle.” The new “state-driven” capitalist model.

I call it absolute BS! Pardon my French.

Adam Smith and the founding fathers of American democracy would have a conniption fit if they heard this!

So let me just add a few charts to the conversation. You might have seen them in other pieces I’ve written. They suggest China’s economy is already failing beyond its recent 35% stock crash – which, by the way, would have been more like 50% if the all-controlling bureaucrats had not totally stepped in and manipulated the markets for their best interest, once again.

Oh… the Mafia would have worshipped the Communist party of China. What’s not to love? Total top-down control and power. Crony wealth in a closed economy. Secrecy. Piracy. I could go on forever. This is heaven for crooks!

Here’s the first chart from Macquarie Research via businessinsider.com, one of our very favorite websites:


After the downturn of 2008, growth in railway freight surged to 20% into early 2010. Why? Massive government stimulus in China! But since, it’s faltered back into negative growth between mid-2012 and mid-2013 and back again since early 2014 – now down 12%! That doesn’t bode well at all for manufacturing and exports.

A growing economy?

Not by my watch!

Then take a look at this one:


This is another statistic that is hard to manipulate. By that I mean hide! Kind of like the statistic that showed how many buildings weren’t using electricity that revealed how many urban condos were empty. Something like 27%!

This one shows that power consumption also surged 28% into early 2010 but has declined systematically ever since. It went negative in July 2014 and again in March of 2015. Now it boasts a mere 1.8% growth.

Does this sound like an economy that is growing at 7%?

Finally, my favorite. One that is so fundamental to middle- and upper-class growth. Not to mention major exporters from the U.S. to Germany to Italy to Japan – even South Korea.

Auto sales.


Again, a surge into early 2010.

And surprise surprise, much slower since. As you can see, auto sales have steadily declined in 2015, currently down 3.4%.

China’s economic model is one of the most unsustainable things in the global economy today. Worse, it’s heavily contributed to a massive real estate bubble that will burst with global consequences.

Do you think this economic model will sustain its mega bubble and the world’s bubble?

I didn’t think so."


Harry Dent
@harrydentjr

Per Quartz, The "Beijing Put" Holding Up Their Market is $1.3 Trillion...So Far. How Long Will That Thumb in the Dyke Hold? Isolated Economy...NOT! How Much Will You Lose?


How Much Will You Lose? Creating Debt Only Works Until You Can't Pay It Back. The Excessive Debt=Productive Lie is Ending. Globally...


Saturday, August 8, 2015

Housing Bubble: How Much Will Your Home Price Fall? "Combined, “vacation” and “investment” properties made up 40% of all US home sales in 2014, a speculative frenzy only seen one time before…in 2006." Mark Hanson update.

"The new-era of occupancy fraud began at the cross highlighted in yellow.
Vacation vs Investment Sales NAR 2001-14
Bottom line: The multi-year “surge” in “second/vacation” home purchases is largely driven by individual buyers and their agents/lenders chasing the rush of “investment” property speculators — who made headlines daily for years – committing fraud to get their slice of the “investment” property miracle. Just like from 2005 to 2007."