Friday, July 31, 2015

Oil Prices: The Market Speaks--5 year Projections Lowest Since 2009. Weak Crude Prices Here to Stay? (1 chart)

Market participants are pricing 5-year futures below 2009, and the lowest since 2006.

Are market participants convinced that low crude prices here to stay?


Wednesday, July 29, 2015

Why Rents Will Keep Rising; and Is Buying a Home a Good Investment? (5 Charts)


"Continuing with the US economy, the country's rental crisis is worsening. Here are two charts that tell us why rental costs will continue to rise sharply.


1. Growth in US households is now at pre-recession levels, driving demand for housing.

Source: @SoberLook, US Census Bureau

2. At the same time rental vacancies continue to slide - now at levels we haven't seen in some 30 years.


We continue to see ongoing shift away from homeownership as the homeownership rate declines.


Moreover, this trend is quite clear in the numbers of US rental vs owner occupied housing units (note that the housing correction started in 2006).


Part of the unease with US homeownership is the fact that if you bought a house 10 years ago, you would just be breaking even (on average). Add to that inflation, maintenance, etc. and it makes for a really bad investment. Of course the tightness in the mortgage market isn't helping."


Source: SoberLook.com


Is The Chinese Downturn for Real? (1 Chart)

"In 2007, current First Vice Premiere of China, Li Keqiang, admitted to the US ambassador to China that ALL Chinese data, outside of electricity consumption, railroad cargo, and bank lending is for 'reference only.'"

Well...here's a reference!


Draw your own conclusions...

Material quoted from:

Graham Summers
Phoenix Capital Research


Toxic Energy Debt...Toxic Farmlard Debt? The End of the Farmland Bubble? (1 Chart)


Monday, July 27, 2015

Durable Goods Flash Recession: "We are going to need much more double-seasonal-adjustments to fix this data."

"Durable Goods new orders has now fallen 5 months in a row (after revisions) flashing a orangey/red recession warning.


After 2 weak months, Durable Goods bounced more than expected in June (+3.4% vs +3.2% exp) - though non-seasonally-adjusted dropped 3.1% MoM. But ex-Transports remain deeply in recession territory.


There was an  unexpected drop in Capital Goods Shipments non-defense Ex-Air which fell 0.1% (against expectations of a 0.6% rise), but mosty worrying is that Core CapEx collapsed 6.6% YoY - the second biggest decline since Lehman.


We are going to need much  more double-seasonal-adjustments to fix this data."
Charts: Bloomberg, ZH


"The global oil market surplus is the biggest since 1998, when prices slumped below $10 a barrel…"

Sunday, July 26, 2015

Bail-Ins Funded by DEPOSITORS--Next downturn...Coming to a bank near U? (U as in U.S.A.)


" the greater the ultimate bail out cost, and the greater the haircut of not only equity and debt stakeholders but also depositors...

Others, including Germany, however, are lukewarm and could push for losses for large depositors with more than 100,000 euros on their accounts, or bondholders....

Any such direct ESM aid requires that losses first be imposed on some of the banks' bondholders and even large depositors...

Whatever sympathy there was for Greece has evaporated..."


LINK


"...no question that North American production of crude oil is stalling...it remains massively elevated relative to last year."


"The ability to bring capacity back online quickly is the reason we saw US rig count unexpectedly increase last week. This creates a natural near-term cap on crude prices, above which production can rise quickly."


Iran:


LINK: Rude awakening for those who ignored the energy markets' warning signs


Thursday, July 23, 2015

Charles Hugh Smith: "Is the Echo Housing Bubble About to Burst?"

"Echo bubbles aren't followed by a third bubble.
Speculative bubbles that burst are often followed by an echo bubble, as many participants continue to believe that the crash was only a temporary setback.
The U.S. housing market is experiencing a classic echo bubble. Exhibit A is the Case-Shiller Housing Index for the San Francisco region, which has surged back to levels reached at the top of the first bubble:
Exhibit B is the Case-Shiller 20 City Housing Index, which has notched a classic Fibonacci 62% retrace of the first bubble's decline.
Several things pop out of the Case-Shiller San Francisco chart. One is the symmetry of the two stages of the initial housing bubble: the first leg rose 80% from 1997 to 2001, and the second leg also rose about 80% from 2003 to 2007.
There is also a time symmetry, as each leg took about five years.
The echo bubble has now inflated for roughly the same time period, and has almost fully retraced the 45% decline from the 2007 peak. Though recent buyers may hope this bubble will be different from all previous bubbles (i.e. it will never pop), history suggests the echo bubble will be fully retraced in a sharp decline lasting about two to three years, in rough symmetry with the collapse of the first housing bubble 2008-2010.
The broader 20-city Case-Shiller Index reflects the same time symmetry: the echo bubble and the initial housing bubble both took about the same length of time to reach their zenith. Once again, we can anticipate a symmetrical decline that roughly parallels the 33% drop from 2007 to 2009.
There is one key difference between the first bubble and the echo bubble: echo bubbles aren't followed by a third bubble. Markets often give second-chances, but they rarely offer third-chances."
Charles Hugh Smith


Just a little reminder about HOW SECURE your CASH in the BANK is?? (0.03%?)


LINK

Insurance is only as good as the actual historical performance of the promise during economic storms (bail outs necessary?) plus the strength of it's current balance sheet relative to future potential claims in WORST CASE scenarios.


China: A Slow (But Manipulated) Death? "capital outflow >$224B in Q2..."beyond anything seen historically"

"Capital exodus from China reaches $800bn as crisis deepens

China is reverting to credit stimulus after attempts to engineer a stock market boom failed horribly. The day of reckoning is delayed again

By the time police were alerted to the operation some 200 people, mostly small business owners, had left deposits of between 100,000 yuan and 20 million yuan
The Chinese central bank is being forced to run down the country's foreign reserves to defend the yuan Photo: Alamy
China is engineering yet another mini-boom. Credit is picking up again. The Communist Party has helpfully outlawed falling equity prices.
Economic growth will almost certainly accelerate over the next few months, giving global commodity markets a brief reprieve.
Yet the underlying picture in China is going from bad to worse. Robin Brooks at Goldman Sachs estimates that capital outflows topped $224bn in the second quarter, a level "beyond anything seen historically".
The Chinese central bank (PBOC) is being forced to run down the country's foreign reserves to defend the yuan. This intervention is becoming chronic. The volume is rising. Mr Brooks calculates that the authorities sold $48bn of bonds between March and June.
Charles Dumas at Lombard Street Research says capital outflows - when will we start calling it capital flight? - have reached $800bn over the past year. These are frighteningly large sums of money.
China's bond sales automatically entail monetary tightening. What we are seeing is the mirror image of the boom years, when the PBOC was accumulating $4 trillion of reserves in order to hold down the yuan, adding extra stimulus to an economy that was already overheating.
The squeeze earlier this year came at the worst moment, just as the country was struggling to emerge from recession. I use the term recession advisedly. Looking back, we may conclude that the world economy came within a whisker of stalling in the first half of 2015.
The Dutch CPB's world trade index shows that shipping volumes contracted by 1.2pc in May, and have been negative in four of the past five months. This is extremely rare. It would usually imply a global recession under the World Bank's definition.
The epicentre of this crunch has clearly been in China, with cascade effects through Russia, Brazil and the commodity nexus..."


Ray Dalio: "China matters after all...our views on China have changed... there are no safe places to invest...it appears that the repercussions of the stock market’s declines will probably be greater..."

"As The Wall Street Journal reports,
The move adds Mr. Dalio and Bridgewater to a growing chorus of high-profile investors who arechallenging the long-held view that China’s rise will provide a ballast to a whole host of investments, from commodities to bonds to shares in multinational firms. For a generation, bets on China’s rising middle class have been commonplace on Wall Street and beyond as investors have looked to diversify their holdings.

But with the country’s stocks on a roller-coaster ride this summer, those beliefs are being tested. The world’s second-largest economy faces renewed questions about the sustainability of its growth and the government’s commitment to loosening its grip on the country’s heavily controlled markets.
And so as Bridgewater's Ray Dalio explains, our views about China have changed as a result of recent developments in the stock market.
We previously conveyed our thinking about the debt and economic restructurings being negative for growth over the near term and positive for growth over the long term—i.e., that it is a necessary and delicate operation that can be well managed.  While we had previously considered developments in the stock market to be supportive to growth, recent developments have led us to expect them to be negative for growth.  While we would ordinarily consider the impact of the stock market bubble bursting to be a rather small net negative because the percentage of the population that is invested in the stock market and the percentage of household savings invested in stocks are both small, it appears that the repercussions of the stock market’s declines will probably be greater.

Because the forces on growth are coming from debt restructurings, economic restructurings, and real estate and stock market bubbles bursting all at the same time, we are now seeing mutually reinforcing negative forces on growth.  While at this stage it is too early to assess how strongly the stock market’s decline will pass through negatively to credit and economic growth, we will soon have indications of this.  We will be watching our short-term indicators of Chinese credit and economic growth carefully to see what the pass through to the economy of these developments is like.
We have seen this happen  before, and as Dalio explains, this creates a not insignificant drag on growth...
The stock market and debt bubble bursting simultaneously has happened many times before in many countries.  We identified 28 cases among major economies in the last 100 years. While no two cases are exactly the same, the basic dynamics of such cases and the tools for treating them are essentially the same.  Looking at these other cases provides perspective concerning the range of possible outcomes and the most effective ways of using the available tools. The most analogous cases created a depressant on real GDP growth of 1.8% on average, annually, for three years relative to what growth would have been without these events; bad cases saw an annual drag of 4% for three years; and, well managed cases saw no drag over three years (i.e., growth averaging its potential). We would expect China’s outcome to be within that range, depending on how Chinese policy makers use their tools.

The negative effects of the stock market declines will come from both the direct shifts in wealth and the psychological effects of the stock market bubble popping.  Though stock prices are significantly higher than they were two years ago, the average investor in the stock market has lost money because more stocks were bought at higher prices than were bought at lower prices.  We now estimate stock market losses in the household sector to be significant—i.e., about 2.2% of household sector income and 1.3% of GDP.  However, these losses appear to be heavily concentrated in a small percentage of the population as only 8.8% of the population owns stocks.  These are rough estimates.  We don’t yet know who is experiencing what losses.  Such information usually surfaces in the days and weeks after the plunge.  Even more important than the direct financial effects will be the psychological effects."


LINK


Tuesday, July 21, 2015

"Three Huge Reasons Why the Fed Cannot Let Rates Normalize"

"The Fed continues to dangle hints of a “rate hike” in front of investors… but the reality is that as far as any significant raise in rates, its hands are tied.

True, the Fed may raise rates from 0.25% to 0.3% or possible even 0.5% sometime in the next 24 months… but these moves will be largely symbolic.

There are three reasons for this:

1)   There are over $555 trillion in interest-rate based derivatives trades sitting on the big banks balance sheets globally.

2)   The US Dollar carry trade is over $9 trillion in size.

3)   Many Western welfare states would go bankrupt if rates normalized.

Regarding #1… the Fed cannot risk a significant rise in rates, as doing so would potentially burst the bond bubble. Bonds have been in a bull market for over 30 years now. Today, globally the bond market is over $100 trillion in size. And there are over $555 trillion in derivatives that trade based on these bonds.

This is why former Fed Chairman Ben Bernanke admitted that rates would not normalize anytime during his “lifetime”during a closed-door luncheon with several hedge funds last year. For rates to normalize (meaning rise to the historic average of 4%+) would trigger a derivatives implosion. Bernanke knows this. And current Fed Chair Janet Yellen knows it too.

Given that ALL of the Fed’s actions over the last seven years have been devoted to propping up the insolvent big banks (insolvent due to their massive derivatives portfolios), the Fed cannot and will not risk any interest rate surprises.

Regarding item #2 (the US Dollar carry trade), there are over $9 trillion in borrowed US Dollars sloshing around the financial system. These are effectively US Dollar (shorts) as when you borrow in one currency to fund a carry trade you are effectively shorting that currency.

US Dollar deposits yield 0.25%. The Yen yields 0.001%, while the Euro yields negative 0.2% and the Swiss Franc yields negative 0.75%.

In simple terms, the US Dollar is extremely attractive as a store of value relative to most major world currencies. This is why capital has been flowing into the US Dollar, pushing the US Dollar to a 10 year high.

The flip side of this is that every upward move the Dollar makes against other currencies puts more pressure on the $9 trillion worth of US Dollar carry trades. This is why the US Dollar’s rally has been so aggressive: because much of it was carry trades blowing up forcing traders to cover their US Dollar shorts.
On that note, the US Dollar is currently breaking out against most major world currencies.


This is already a big enough concern that the Fed has been mentioning it in FOMC communiqués. Any rate hike will only INCREASE the interest rate differential between the US Dollar and other major world currencies… which in turn would drive even more capital to the US Dollar… and put even more pressure on the $9 trillion US Dollar carry trade.

Finally, regarding #3 (the impact of interest rates on welfare states)… it is no secret that most western nations are bankrupt due to excessive social welfare expenses. Most nations rely heavily on the bond markets to fund their social spending patterns as tax revenues don’t come anywhere near enough to cover them.


In the US, a 1% increase in interest rates means over $100 billion more in interest rate payments. The US is already running a deficit (meaning that it spends more than it takes in via taxes) and has been for most of the last 20 years. As the above charts who, most Western developed nations are in similar situations.

If the Fed began to let rates normalize it would render numerous nations insolvent.  Every asset under the sun trades based on its risk relative to Us Treasuries (the so called “risk free rate”). If US yields rise, so will yields around the world.

And the world cannot afford that.

In short, the world is awash with debt. The bond market has ballooned up to $100 trillion in size. And most nations are struggling to service their debt loads even with rates at historic lows.

At some point, the bond bubble will burst. And when it does, entire countries will go bust..."

Graham Summers
Phoenix Capital Research


Deflation Has Arrived?

Continuous Commodity Index (GCC) lowest since 2009...


Bloomberg Commodity Index lowest since 2002...


(h/t SoberLook)


Monday, July 20, 2015

"Oil and Coal Indicate the Global Economy is in a Free Fall"?

"In the US, Coal has become a political hot button. Consequently it is very easy to forget just how important the commodity is to global energy demand. Coal accounts for 40% of global electrical generation. It might be the single most economically sensitive commodity on the planet.

With that in mind, consider that Coal ENDED a multi-decade bull market back in 2012. In fact, not only did the bull market end… but Coal has erased ALL of the bull market’s gains (the green line represents the pre-bull market low). For all intensive purposes, the last 13 years were a wash.


Those who believe that the global is in an economic expansion will shrug this off as the result if the US’s shift away from Coal as an energy source. The US accounts for only 15% of global Coal demand. The collapse in Coal prices goes well beyond US changes in energy policy.
What’s happening in Coal is nothing short of “price discovery” as the commodity moves to align itself with economic reality. In short, the era of “growth” pronounced by Governments and Central Banks around the world ended. The “growth” or “recovery” that followed was nothing but illusion created by fraudulent economic data points.

We get confirmation of this from Oil.

For most of the “so called” recovery, Oil gradually moved higher, creating the illusion that the world was returning to economic growth (demand was rising, hence higher prices).


That blue line could very well represent the “false floor” for the recovery I mentioned earlier. Provided Oil remained above this trendline, the illusion of growth via higher energy demand was firmly in place.

And then Oil fell nearly 60% from top to bottom in less than six months.


As was the case for Coal, Oil’s drop was nothing short of a bubble bursting. From 2009 until 2014 Oil’s price was disconnected from economic realities. Then price discovery hit resulting in a massive collapse.

Moreover, the damage to Oil was extreme. Not only did it collapse 60% in a matter of months. It actually TOOK out the trendline going back to the beginning of the bull market in 1999.


This is a classic “ending” pattern. Breaking a critical trendline (particularly one that has been in place for several decades) is one thing. Breaking it and then failing to reclaim it during the following bounce is far more damning.

We’ve just took out this line AGAIN a week or so ago. Oil will be dropping down to $30 per barrel if not lower.

In short, the era the phony recovery narrative has come unhinged.  We have no entered a cycle of actual price discovery in which financial assets fall to more accurate values. This will eventually result in a stock market crash, very likely within the next 12 months..."

Graham Summers
Phoenix Capital Research


"...this time is no different, no matter what you are preached..."


LINK


Friday, July 17, 2015

Is Mr. Summers Correct? "The financial media forgets: Crises do not unfold in just a few weeks."

July 17, 2015

"The markets bounced this week because... honestly it's options expiration week and Wall Street traders are using any excuse to gun the markets and shred anyone who sold call options last month.

The financial media, as usual, believes that the bounce is due to some positive change for Greece or China. Both both of those countries continue to witness their financial systems implode.

The financial media forgets: Crises do not unfold in just a few weeks.

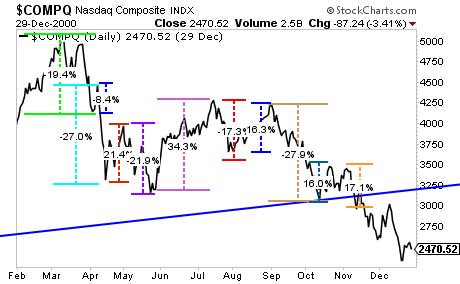
Look at the Tech Crash... stocks experienced over EIGHT prices moves greater than 16% over the course of 16 months. 


Every single bounce was heralded as a sign that that "the worst was over,"...but it wasn't... and stocks continued to work their way down DESPITE the bounces, until they lost over 77% in two years' time.


The same thing is happening today... China, the third largest economy in the world, is imploding, with both its economy AND its stock market in collapse.

Indeed, the China chart looks almost EXACTLY like the NASDAQ did when its bubble first burst.


Small wonder that institutional investors and corporate insiders are using the bounce in stocks to dump shares by the truckload. In short... the next Crisis is here... ."


Graham Summers
Phoenix Capital Research


Life Insurance: The Basics


Rental bubble? What rental bubble?


LINK